SDG 10 in Numbers This stacked area chart illustrates the number of eligible applicants for underrepresented group applications. The overall application numbers show a clear upward trend,
SDG 9 in Numbers This bar graph illustrates the number of patents citing research across five academic years, showing a clear downward trend. The number of patents
SDG 8 in Numbers This stacked area chart illustrates the number of students with work placements for more than a month across seven academic years, from 2017-2018
SDG 7 in Numbers This line graph displays the SDG 7 Total Energy Used (GJ) across five academic years, indicating a notable increase overall. The total
SDG 6 in Numbers The line graph showing total water consumption from four campuses from 2021 to 2024 illustrates significant variation over the period. Consumption rose
SDG 5 in Numbers The line graph showing the percentage of female senior academics from 2019 to 2024 reveals a fluctuating yet declining trend. The proportion
SDG 4 in Numbers The line graph showing the number of students starting a degree from 2019 to 2024 demonstrates fluctuating but generally positive growth. Numbers increased
SDG 3 in Numbers This graph illustrates the proportion of graduates in health professions between 2019 and 2024. The number of graduates in health-related fields increased
SDG 2 in Numbers The line chart presents the trend in the number of graduates in agriculture and aquaculture, including sustainability aspects, from 2019 to
SDG 1 in Numbers This line graph illustrates the percentage of students at Thammasat University who received financial aid due to poverty from the 2020-2021
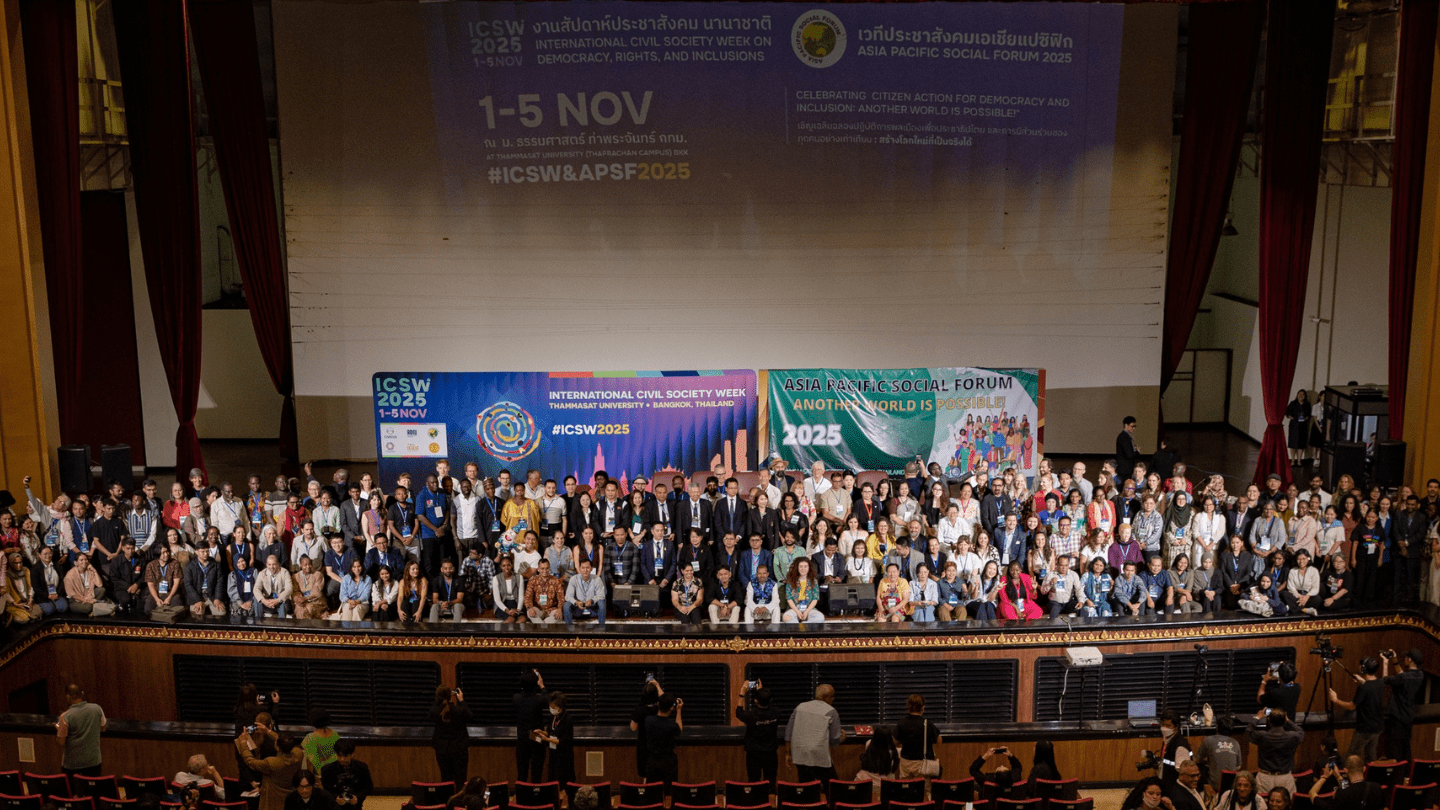
HIGHLIGHTS Thammasat University, a long-standing bastion of democratic ideals and human rights in Thailand, has once again demonstrated its leadership in driving tangible action towards
In the heart of Pathum Thani, a sprawling 2,100-square-metre area that was once plagued by stagnant floodwaters, unpleasant odours, and a distinct lack of greenery