SDG 7 in numbers The graph shows electricity consumption across Thammasat University’s campuses from 2018 to 2023. Rangsit Campus leads, peaking at 73,668,968 kWh in
SDG 6 in numbers The graph shows Thammasat University’s water consumption across four campuses from 2018 to 2023. Consumption appeared stable until 2021, rising sharply
SDG 5 in numbers The graph shows the percentage of female senior academics at Thammasat University from 2018 to 2023, starting at 51% in 2018–2019,
SDG 4 in numbers The graph shows Thammasat University’s new enrollments from 2018 to 2023, starting with 8,505 students in 2018–2019, rising to a peak
SDG 3 in numbers The graph shows a steady rise in health profession graduates at Thammasat University, from 952 in 2018–2019 to 1,343 in 2022–2023,
SDG 2 in numbers The graph shows fluctuations in Thammasat University graduates in agriculture and aquaculture with a sustainability focus from 2018 to 2023, starting
SDG 1 in numbers The graph shows a steady rise in students receiving financial aid due to poverty from 2018 to 2023, starting at 17%
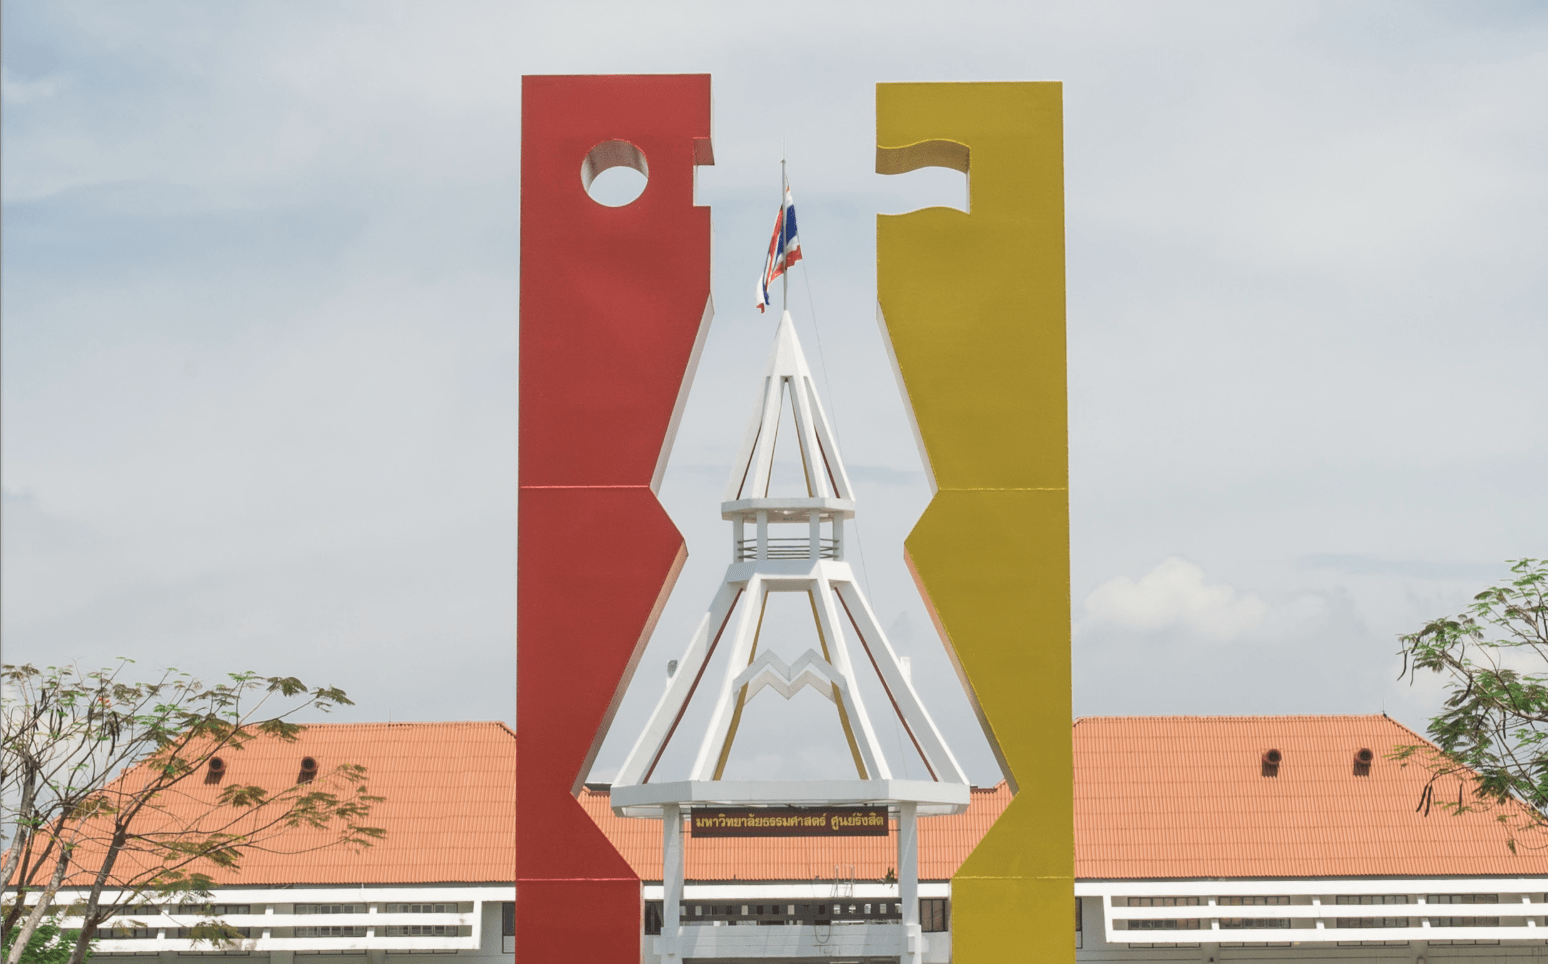
Since its establishment in 1934, Thammasat University has upheld the principle of “For the People,” standing as a pillar of knowledge, democracy, and social justice